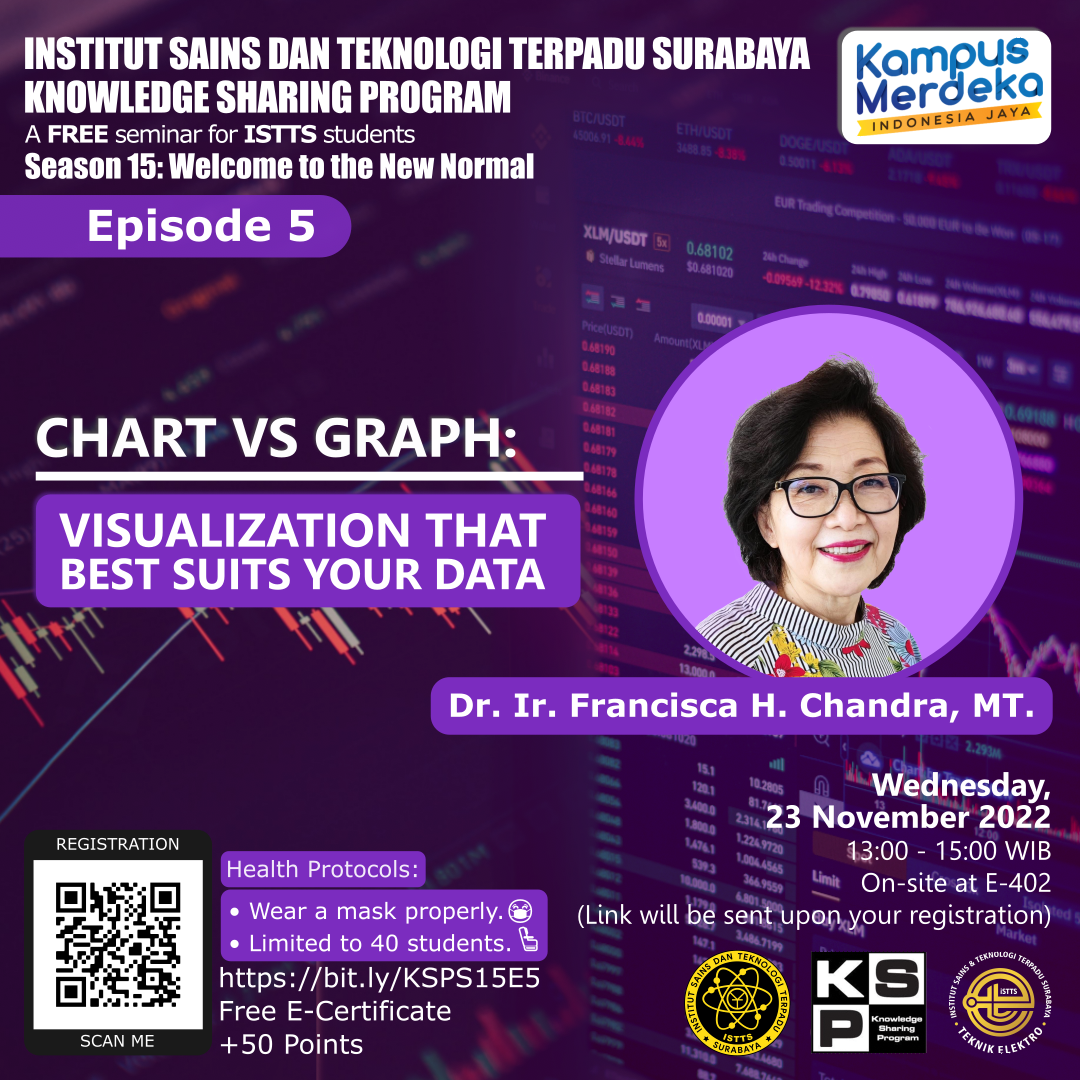
Chart vs Graph: Visualization That Best Suits Your Data
In the event of when we want to visualize our data, the majority often choose to represent it in charts or graphs. But in that moment we choose one of those options, is it truly the most suitable visualization that is suitable for the data they represent? Find out in this episode of KSP!


